Upon navigating throughout the website, the importance of the tools and calculators on this website became apparent. I started at the risk calculator, where you enter different demographics that will compute your risk of cardiovascular disease based on the Framingham Health Study. Although this calculator may not be accurate for everyone, it provides an estimate that could be used as a baseline for your health. A tool like this could be used as an awakening for someone; Someone who enters their data and realizes that they may be a high risk, may decide to change their lifestyle.
Here is the visual and data I received after entering my demographics.

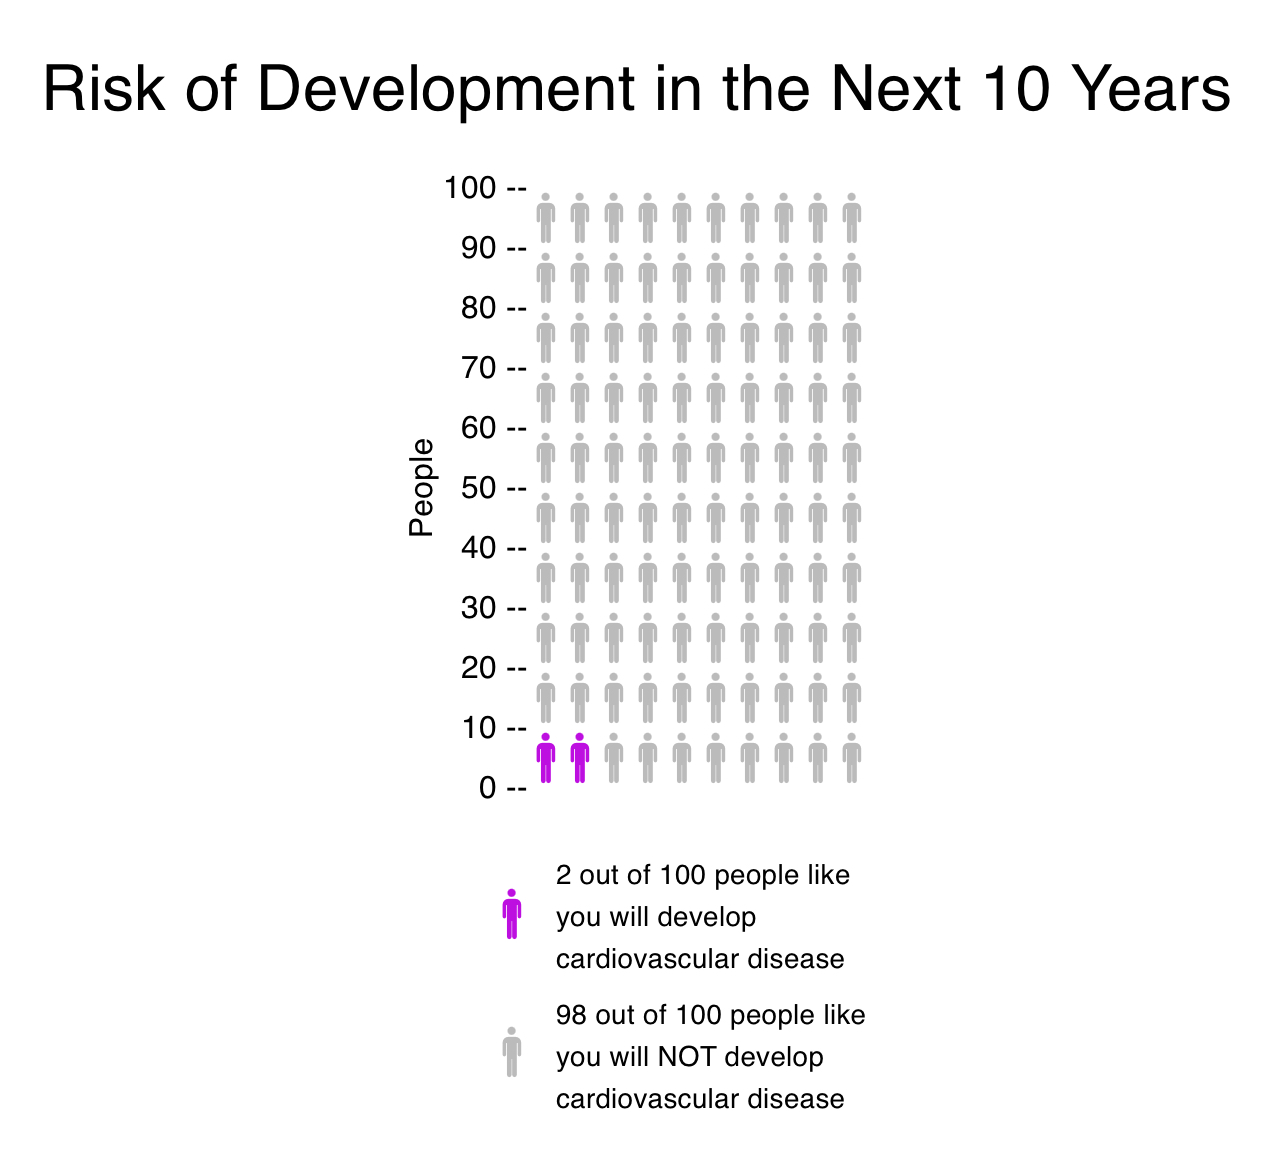
As you can see, based on the risk calculator my likelihood of developing a cardiovascular disease in the next 10 years is about 2%. I then used the icon array to put more perspective on my data.

This visual shows the percentage of people with similar demographics as mine that would be likely to develop a cardiovascular disease within the next 10 years (out of 100).
Like I said before, this tool can be used as a great estimate for people’s health. Overall, I believe this website is a step towards modernized health support.