When comparing values, showing differences, similarities, making visualizations to change minds, persuade people, it is important to understanding the readers expectations. Providing the best method to distinguish and compare values, by displaying the numbers in the most effective way. Comparing numbers, and visually representing them correctly comes with research and reconstruction. Including different aspects, seeing many numbers side by side it can lead to confusion and misinterpretations. It is very important to know your audience and determining the best graph and visualization when comparing numbers. There are many tools and software’s available online to help construct visualizations when comparing numbers and finding the best method to represent the data and story.
According to G2’s Learn Hub, which is used for marketing, sales, management, HR, technology, software, and all business topics, some charts that are known for effective methods of comparing numbers are:
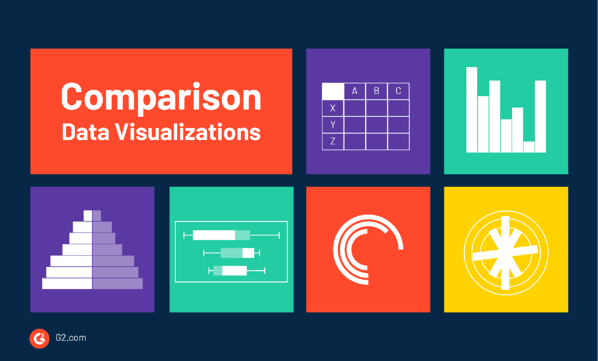
Bar & Column Charts
Table Charts,
Histograms
Population Pyramids
Box and Whisker Plots
Radial Bar Charts
Radial Column Charts
Tally Charts
There are many different types of data visualization and G2’s Learning hub discusses the “67 Types of Data Visualizations” and how to determine if you are using the right one. In addition to the information provided on G2’s learning hub, the following links provides more options of different charts and tools to use for comparing numbers.
G2’s Learning Hub
Tools for comparing numbers!
https://learn.g2.com/types-of-data-visualizations
TABLEAU
TOOL FOR DATA VISUALIZATION:
TABLEAU
Tableau is another platform and tool that is used to communicate information, present it accurately, and understands the importance of data visualization. Tableau platform was founded in Jan 2003, where data meets design. This website helps view business data in a visual way, and the innovation was focused on visual analysis. Tableau helps people and business see and understand data, and their visual analytics for businesses is helping solve problems and compare numbers. Using these software’s available as tools to help give better understand and using the technology available to generate visualizations of data combined with design to help businesses and reaching target numbers or goals. Attached is a video of how simple and easy comparing profit values, or numbers using Tableau.
Recent Comments